Note: This post refers to an archived publication! Visit www.e-benchmarksstudy.com for the most recent versions of all our Benchmarks Studies.
In the U.S., there are more active mobile phones than there are people. Crazy, right? Not only that, but Americans send over 193 billion text messages per month. Many nonprofits have taken note, integrating text messaging into their broader communications strategies to take their programs to the next level. If you’re one of these organizations, you are probably curious about how your program stacks up. That’s where we come in.
When M+R and Mobile Commons published our Nonprofit Text Messaging Benchmarks study oh-so-long ago in 2010, nonprofit mobile lists were growing at rapid rates. Since we suspected that some of this growth was high due to organizations’ relatively small lists and ability to draw from a pool of pre-existing email supporters, we decided to check in and see how mobile lists are faring two years later.
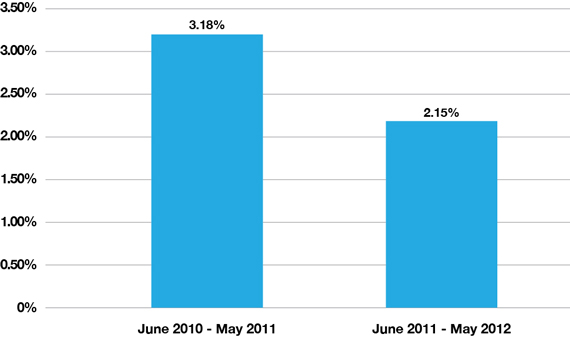
Good news! Our new findings show that mobile lists are continuing to grow at healthy rates. However, we did see a moderate decrease in monthly growth rates in the past year (June 2011 – May 2012) compared to the year before (June 2010 – May 2011). A number of factors could be behind this. Organizations may have already recruited the “low hanging fruit” from their email lists onto their mobile lists. Some subscribers may have already signed up for multiple mobile lists, and are less likely to sign up for any more. Also, a decline in email list growth (a trend we reported in the 2012 eNonprofit Benchmarks Study) could impact mobile recruitment, especially since we found that so many mobile recruits came from nonprofits’ eCRMs.

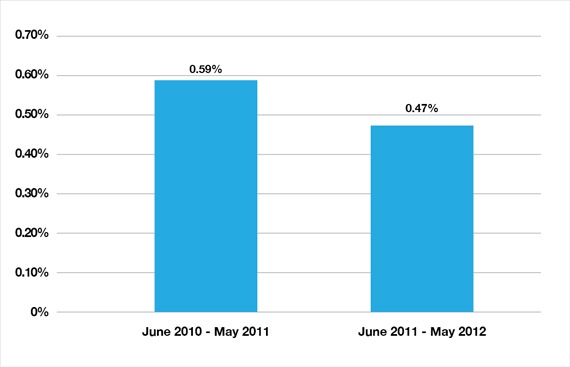
Median Monthly Mobile List Churn
Median monthly churn, or the rate at which mobile numbers “go bad” in a given year, was a low 0.59% for June 2011 – May 2012. When we compared this to the median monthly churn rate of the same period a year ago, we found a slight decrease that correlates with lower monthly growth. It’s important to note that none of the organizations who offered list size data for this study send fundraising appeals via text message, which would have likely prompted more unsubscribes and a higher rate of churn. But it’s still encouraging to see some steady growth coupled with a moderate decrease in churn.

Median Monthly Mobile List Growth
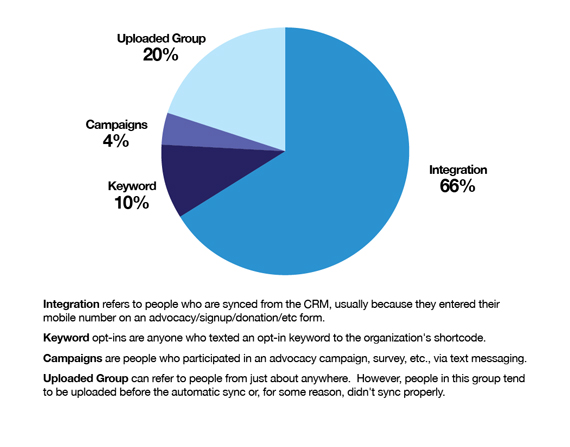
So we know mobile lists are still growing – but where are those supporters coming from? While 14% of mobile lists are made up of subscribers who opt-in via a keyword or mobile campaign (that is, via their mobile phones), the vast majority of subscribers join via online sources, such as by entering a mobile number when signing up to receive emails or taking an advocacy action. So don’t forget to ask people to opt into your mobile list on your email signup or advocacy forms – it can really help boost your mobile recruitment!

List Composition
The most important thing to remember is that every list is different, so keep tracking your own mobile program’s stats and seeing how your program is faring year over year.
We want to hear from you!
Have you seen any interesting trends in your mobile list size? Where are your mobile recruitment efforts focused? Have you changed your list growth strategy over the last 2 years? Let us know in the comments!
Study Methodology
The average given for a metric is the median. Each rate aggregates data from at least 3 study participants. Not all study participants reported data for every metric.
Many thanks to AARP, the Human Rights Campaign, the Humane Society of the United States, the International Rescue Committee, NARAL Pro-Choice America, Planned Parenthood Federation of America, and the U.S. Fund for UNICEF for providing invaluable data on list size and composition, and to Mobile Commons for their help and guidance.
P.S. If you happened to read this post in the first few days it was up, you may have noticed that the labels for the growth and churn charts were switched. Our bad! What you see above is now correct. Sorry for any confusion.

