Is your Facebook ad ‘that friend’?
You know that irritating friend on Facebook who posts nothing but Farmville updates, all day every day? If you’re not keeping your Facebook ads fresh by cycling them, you are that friend.

You know that irritating friend on Facebook who posts nothing but Farmville updates, all day every day? If you’re not keeping your Facebook ads fresh by cycling them, you are that friend.

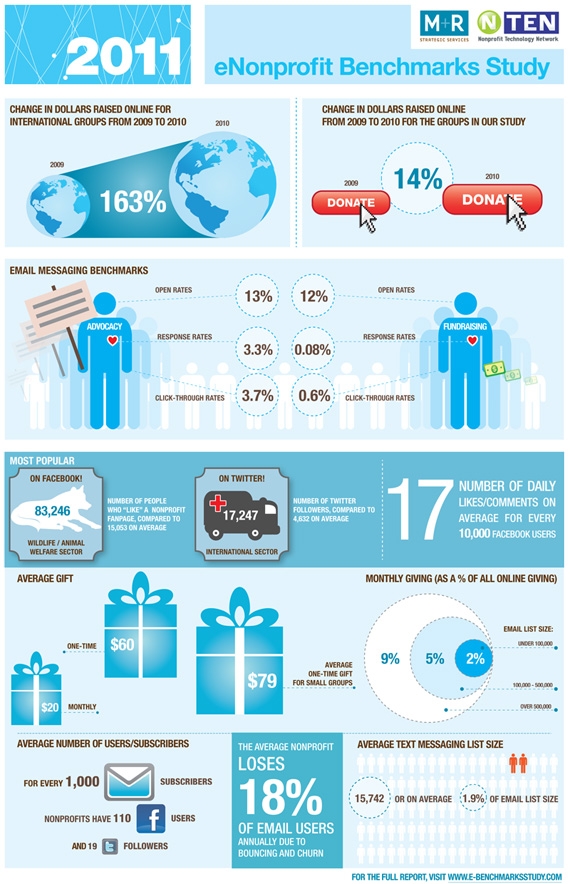
What do benchmarks look like? Here’s our visual take on this year’s 2011 eNonprofit Benchmarks Study – print this out and tack it up on your bulletin board!

More numbers to crunch and charts to geek out over? Check! Take a look at the brand-new 2011 benchmarks report to get this year’s findings.

Be among the first to learn what changed online this year for nonprofits: Join our LIVE panel on the results of the 2011 e-Nonprofit Benchmarks Study on Tuesday March 22nd.
RSVP to join us in New York City, Washington D.C., or via webcast from 2-3:30 p.m. on Tuesday March 22nd.
